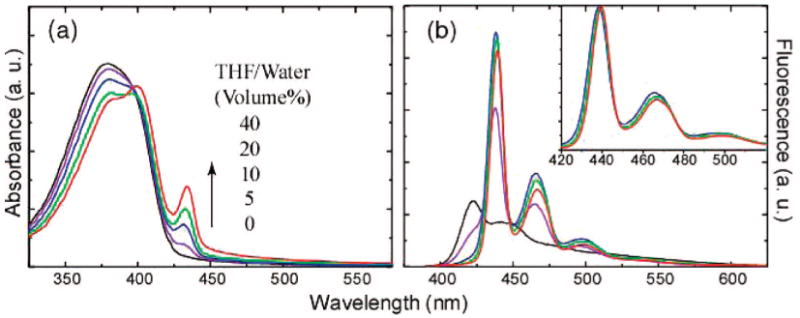
Figure 3.

Absorption spectra (a) and fluorescence emission spectra (b) of PFO nanoparticles containing varying β-phase fractions. The absorption increase (435 nm) of the β-phase is indicated by an arrow, with increasing the THF/water ratio in the swelling. Each sample was diluted to yield an absorbance of 0.1 at 375 nm, and fluorescence spectra were obtained under the 375 nm excitation. The normalized emission spectra shown in the inset indicates a slight red-shift with increasing β-phase fractions.
