
Figure 4.
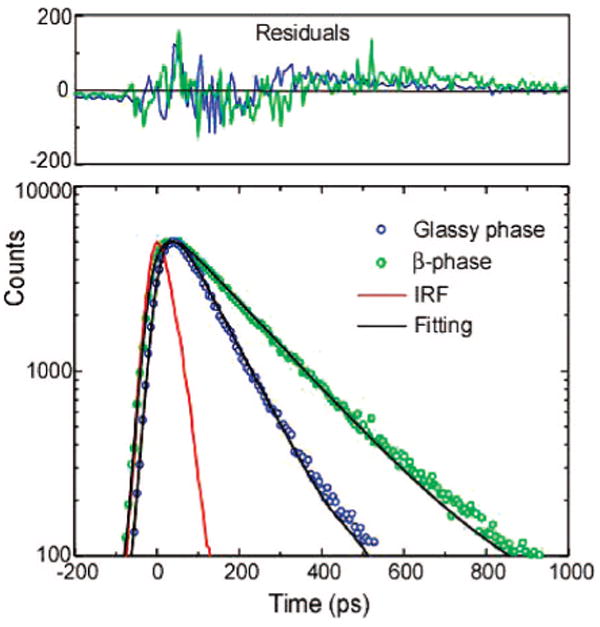
Semi-log plot of fluorescence decays of the glassy and β-phase PFO nanoparticles measured by a TCSPC setup. The red curve shows the instrumental response function (IRF). The scattered symbols represent experimental data, and the solid lines are fitting curves obtained by employing an iterative deconvolution method. Residuals are shown above the fits.