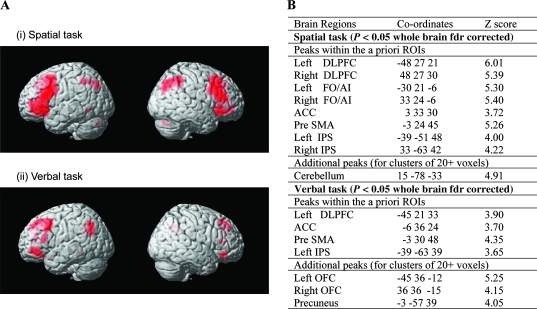
Figure 2.
Neural activation associated with high gf versus low gf task performance. (A) Significant activations at a whole-brain fdr threshold of P < 0.05, rendered onto the canonical T1-weighted brain image of SPM99. (i) Spatial high gf − spatial low gf. (ii) Verbal high gf − verbal low gf. (B) Activation peaks. For significant (fdr, P < 0.05) clusters of any size that overlap the a priori specified ROIs, the table gives peak voxel within the ROI. For other brain areas, peaks are reported only for clusters of 20 or more significant voxels. OFC: orbitofrontal cortex.

