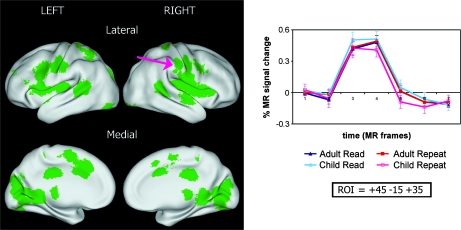
Figure 1.
Regions showing no significant differences between ages or tasks. An example region, location indicated by the arrow, is shown at right, with percent signal change on the y-axis, and time (in MR frames; each MR frame is 3.08 s) on the x-axis. Time courses are shown with standard error of the mean. Coordinates reported for this and all figures are in Talairach space. The orientation of all subsequent brain surfaces will follow the convention above. All surface-rendered images were created using CARET software and surface-based atlases (Van Essen 2002; Van Essen et al. 2001).

