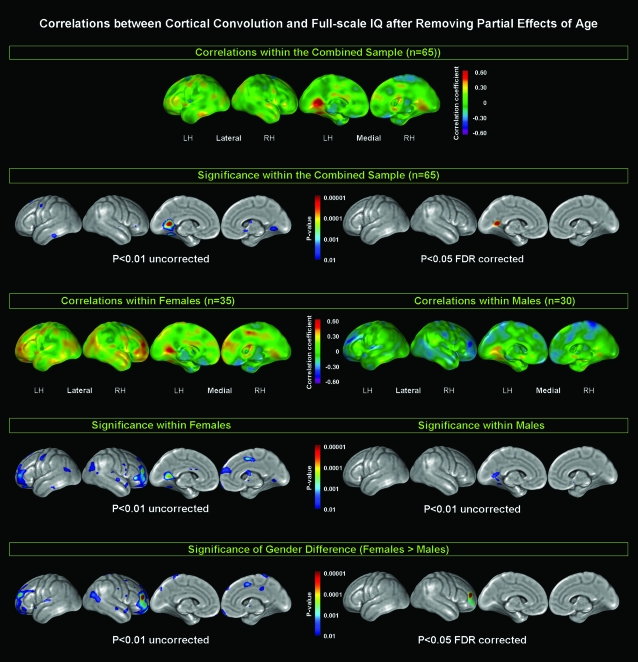
Figure 1.
Relationships between cortical convolution and full-scale IQ, after removing the variance associated with age. Larger positive values of correlation coefficients are color-coded in yellow, orange, and red; negative values appear in light blue, dark blue, and purple (1st and 3rd row). Significance values, both uncorrected at P < 0.01 and FDR corrected at P < 0.05 (if significant) associated with the observed correlations are indexed in color, with gray indicating areas of no significance (2nd, 4th, and 5th row). Rows 1 and 2 illustrate findings for the combined sample (n = 65). Rows 3 and 4 illustrate findings within females (n = 35; left panel) and males (n = 30; right panel) separately. Row 5 illustrates the significance of the gender differences (females > males).

