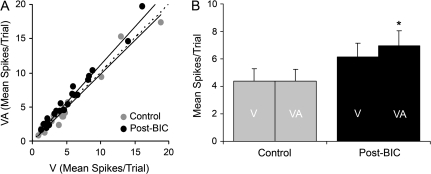
Figure 10.
Comparison of responses of Area 21 neurons to visual and combined visual–auditory stimuli before and after inhibitory blockade with BIC. (A) For the 23 neurons tested, this graph plots the responses (mean spikes/trial) to the visual stimulus alone (V; x-axis) versus those evoked by the combined auditory–visual stimuli (VA; y-axis) under control (light gray symbols) and post-BIC ejection conditions (black symbols). For the control condition, most responses fell on or near the line of unity (dashed line). However, when inhibition was blocked, 4/23 neurons showed significant levels of response facilitation and 87% (20/23) had responses that fell above the line of unity. Regression lines are plotted for the control and post-BIC conditions. (B) The bar graph shows the population (n = 23) response average of the mean spikes/trial (±SEM) to the V and combined condition VA for control (gray) and post-BIC conditions (black). Note that when GABAergic inhibition was blocked, there was a significant difference in the response to visual and combined visual–auditory stimulation (paired t-test, P < 0.001, *).

