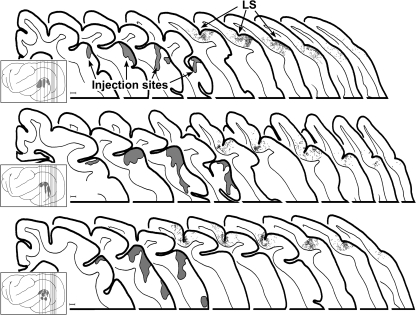
Figure 3.
Orthograde projections from auditory to visual cortex. In each of 3 cases, tracer injection into and around primary auditory cortex produced labeled axons and boutons (each dot = 1 bouton) in the visual area surrounding the lateral suclus (LS) designated Area 21 (Manger et al. 2002). The insets show lateral views of the ferret cortex and the sites of injection for each case; vertical lines indicate location of the coronal sections expanded to the right. The coronal sections, arranged serially from anterior (left) to posterior (right) display the injection sites (gray areas) as well as the locations of labeled boutons. In each case, the density of labeled boutons was highest anteriorly and diminished at more posterior levels. The last section to the right indicates the most posterior level at which labeled boutons were found. Scale bar = 1 mm.

