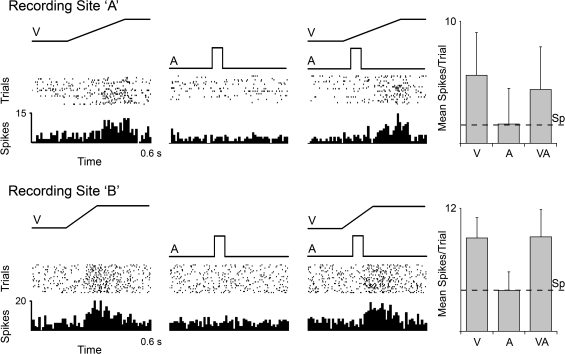
Figure 7.
Responses of Area 21 visual neurons to visual, auditory, and combined visual–auditory stimuli. For 2 representative neurons (marked A and B in Fig. 6), responses to a visual stimulus (ramp labeled “V”), auditory stimulus (square wave labeled A), and combined stimuli (VA) are shown in the rasters (dot = 1 spike; each row = 1 trial) and histograms (10-ms time bins). For both neurons, the visual stimulus elicited a robust response, whereas the auditory stimulus was ineffective. When these same visual and auditory stimuli were combined, the responses of these neurons were not significantly changed from the visual alone condition, as shown in the respective bar graphs (mean spikes/trial ± SD). Spontaneous activity is indicated by the dashed line (Sp).

