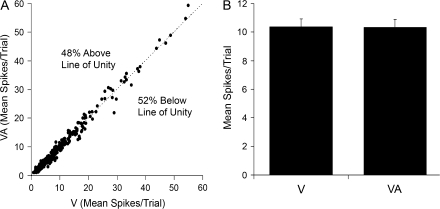
Figure 8.
Comparison of responses of Area 21 neuron population to visual and combined visual–auditory stimuli. (A) For the 296 neurons examined, this graph plots the relationship of neuronal responses (mean spikes/trial) to the visual stimulus alone (V; x-axis) to those evoked by the combined auditory and visual stimuli (VA; y-axis). Most responses fell on or near the line of unity, with a similar number either slightly above (48%; 142/296) or below (52%; 154/296), suggesting that the auditory stimuli had no net effect on the population. (B) The bar graph shows the population (n = 296) response average of the mean spikes/trial (±SEM) to the visual alone (V) and to the combined visual–auditory stimulation (VA), which were not significantly different (P = 0.38, paired t-test).

