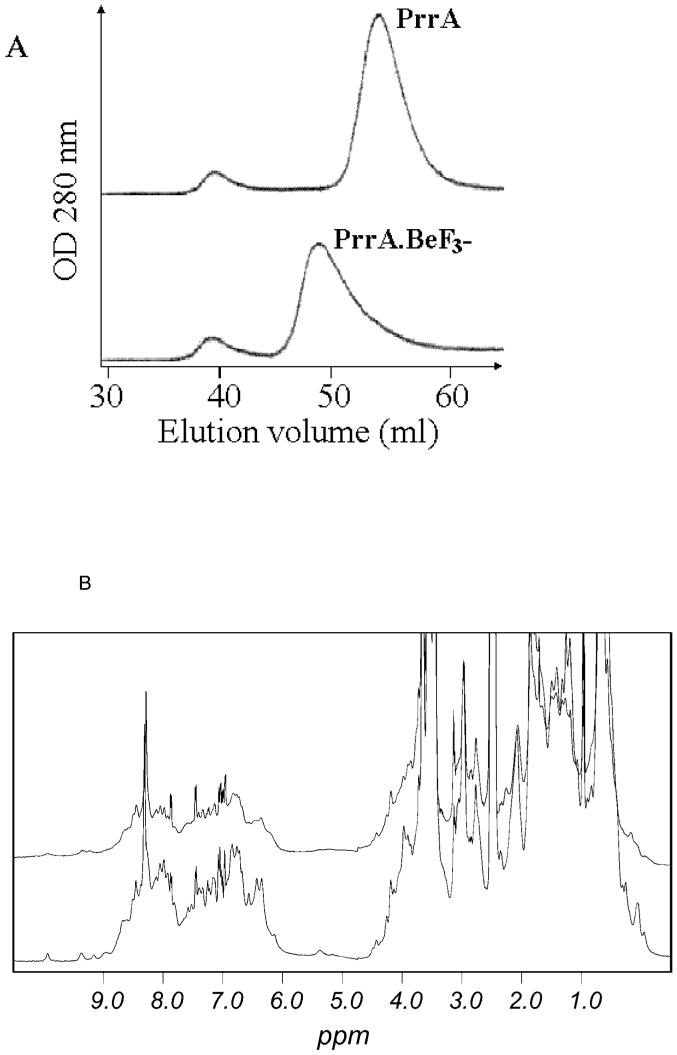
Figure 1.
Dimerisation of PrrA upon addition of BeF3-. A: Superdex G75 gel filtration profile of PrrA and PrrA.BeF3-. PrrA (purified as the monomer) and PrrA.BeF3- were injected onto the column. Monomer and dimer are eluted at their expected molecular weight; the dimer elutes at the same volume as the minor species from the E. coli growth. Some protein aggregates are formed during concentration and are eluted in the void volume (39 ml). The dimer peak has a “tail” suggesting the presence of a low quantity of monomer (<10 %) or an exchange during gel filtration between monomeric and dimeric species. The column was calibrated using standards of known molecular weights: bovine serum albumin (66 kDa), ovalbumin (45 kDa), carbonic anhydrase (26 kDa), lysozyme (14.3 kDa) and insulin (5.8 kDa).
B: 1H 1D spectra of PrrA and PrrA.BeF3-. Spectra of PrrA (bottom) and PrrA.BeF3- (top) (500 μM) were recorded at 2°C under identical conditions and overlaid. The spectrum of PrrA.BeF3- shows a large broadening of the NMR signal resulting in an important decrease in signal intensity. Dimer purified from E. coli has a very similar NMR spectrum (not shown).

