
Figure 3.
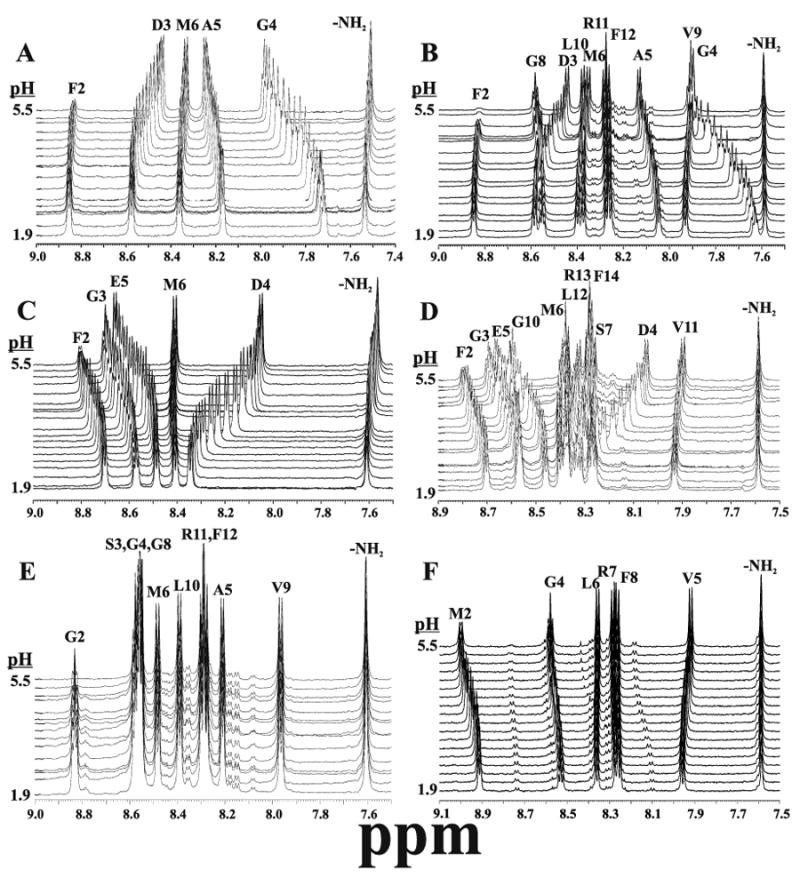
Amide region of one-dimensional NMR data, collected as a function of pH from about 1.9 to 5.5. Peaks are labeled with their assigned amino acids and the panels correspond to the following peptides: (ADD peptide sequences here as well) A. Peptide 3 = DFDGAM-NH2, B. Peptide 2 = DFDGAMPGVLRF-NH2, C. Peptide 8 = GFGDEM-NH2, D. Peptide 7 = GFGDEMSMPGVLRF-NH2, E. Peptide 5 = SGSGAMPGVLRF-NH2, F. Peptide 1 = EMPGVLRF-NH2. pH dependent interactions are summarized in Figure 5, and complete pKa analyses are provided in supplementary material.