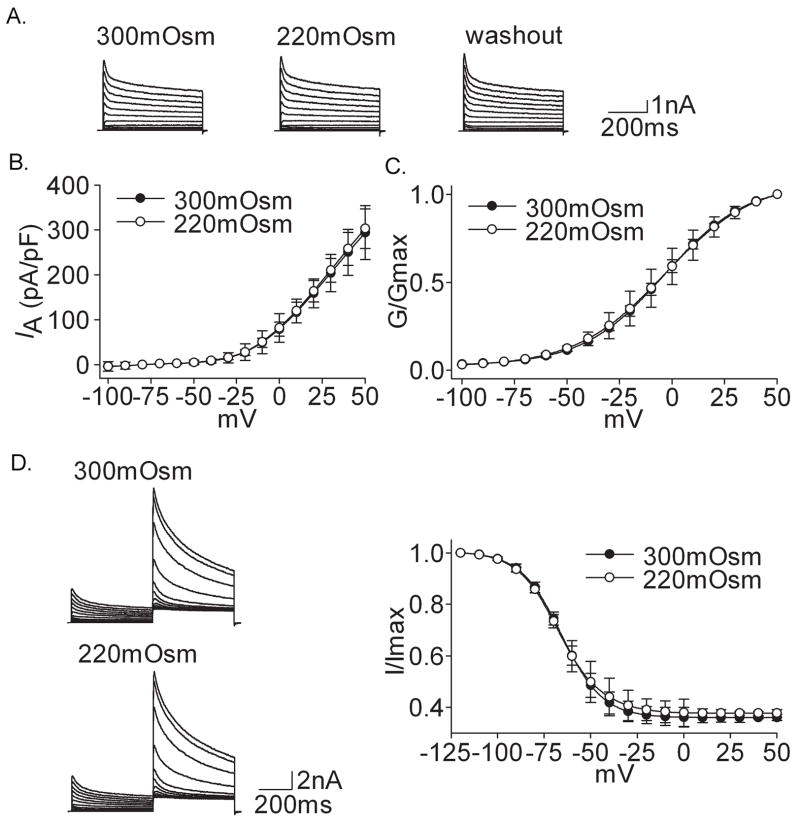
Figure 2. Effect of hypotonicity on IA.
A. After exposure to hypotonicity (220mOsm), IA was not affected and the peak amplitude was 5.87 nA, 5.91 nA and 5.93 nA before, during and after hypotonicity application, respectively. B. I–V curve did not change before and during hypotonicity treatment. C. G–V curve did not shift in the presence of hypotonicity. V0.5 was −3.57±0.18 mV and −3.33±0.72 mV (n=11, paired t test, P>0.05) for 300mOsm and 220mOsm, respectively; k was 19.47±1.20 and 21.08±0.75 (n=11, paired t test, P>0.05), respectively. Data were transformed from the I–V data shown in B. D. Hypotonicity had no effect on inactivation–voltage curve. V0.5 was −68.47±0.23 mV and −69.42±0.21 mV (n=11, paired t test, P>0.05) for 300mOsm and 220mOsm, respectively; k was −9.37±0.20 and −9.67±0.15 (n=11, paired t test, P>0.05), respectively.

