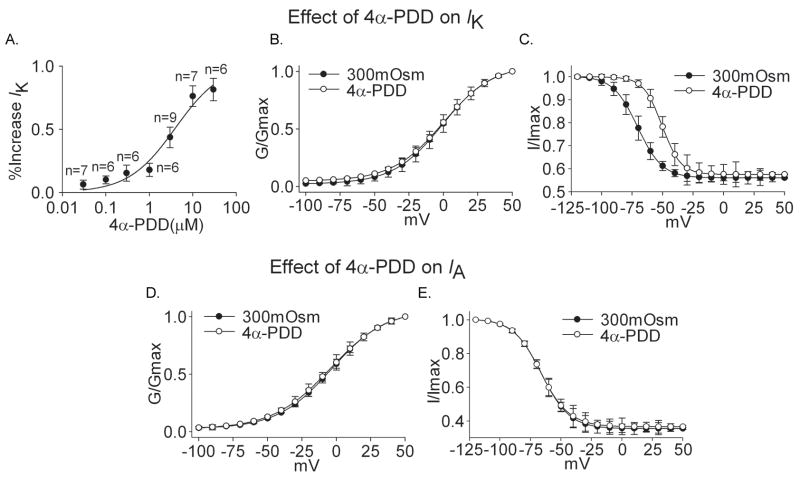
Figure 6. Effect of 4α-PDD on IK and IA.
A. The plot shows the percentage in increase of IK by 4α-PDD at concentrations of 0.03, 0.1, 0.3, 1.0, 3.0, 10 and 30 μM. The dose–response curve fits to Hill equation with IC50 being 4.01 μM and n being 0.80. B. G–V curve of IK did not shift upon exposed to 3.0 μM4α-PDD. V0.5 was −0.58±0.60 mV and −0.11±0.48 mV (n=9, paired t test, P>0.05) before and during 4α-PDD treatment, respectively; k was 17.83±0.53 and 18.38±0.42 (n=9, paired t test, p>0.05), respectively. C. After application of 3.0 μM 4α-PDD, inactivation–voltage curve of IK significantly shifted to the depolarizing direction. V0.5 was −70.44±0.10 mV and −50.40±0.42 mV (n=9, paired t test, P<0.05) before and during 4α-PDD treatment, respectively; k was −10.08±0.08 and −7.60±0.36 (n=9, paired t test, P<0.05), respectively. D. Application of 3.0 μM 4α-PDD had no effect on G–V curve of IA (300mOsm: V0.5=−3.46±0.17 mV, k=19.62±0.15; 4α-PDD: V0.5=−4.42±0.25 mV, k=20.80±0.23, n=8, paired t test, P>0.05). E. Application of 4α-PDD had no effect on inactivation–voltage curve of IA either (300mOsm: V0.5=−65.93±0.29 mV, k=−11.49±0.25; 4α-PDD: V0.5=−66.38±0.74 mV, k=−11.58±0.65, n=8, paired t test, P>0.05).

