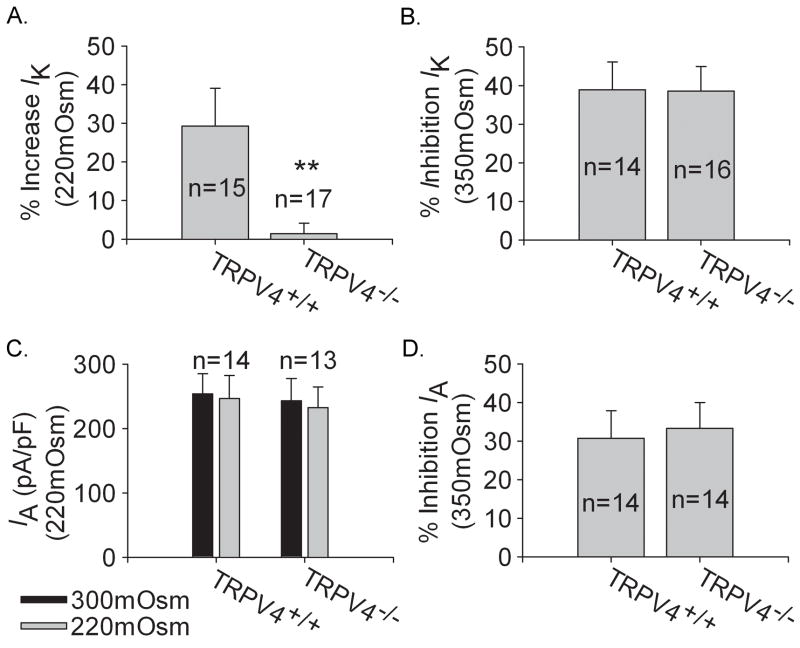
Figure 7. Effects of anisotonicity on IK and IA in TG neurons from TRPV4+/+ and TRPV4−/− mice.
A. Upon exposure to hypotonicity (220mOsm), IK was increased by 29.21±9.81% (n=15) in TRPV4+/+ mice TG neurons, which was significantly different from that in TRPV4−/− mice (1.41±2.72%, n=17) (unpaired t test, P<0.01). B. After exposure to hypotonicity (220mOsm), IA was not significantly affected. On the average, in TRPV4+/+ mice TG neurons, the amplitude was 253.75±31.43 pA/pF and 243.19±33.99 pA/pF (n=14, paired t test, P>0.05) before and during hypotonicity treatment, respectively, and in TRPV4−/− mice TG neurons IA was 246.42±35.52 pA/pF and 232.13±32.58 pA/pF (n=13, paired t test, P>0.05), respectively. C. After exposure to hypertonicity (350mOsm), IK was reduced by 38.82±7.25% (n=14) and 38.52±6.38% (n=16) in TRPV4+/+ and TRPV4−/− TG neurons respectively (unpaired t test, P>0.05). D. After exposure to hypertonicity (350mOsm), the inhibition of IA by hypertonicity was 30.68±7.16% (n=14) and 33.31±6.61% (n=14) in TRPV4+/+ and TRPV4−/− mice TG neurons respectively (unpaired t test, P>0.05).

