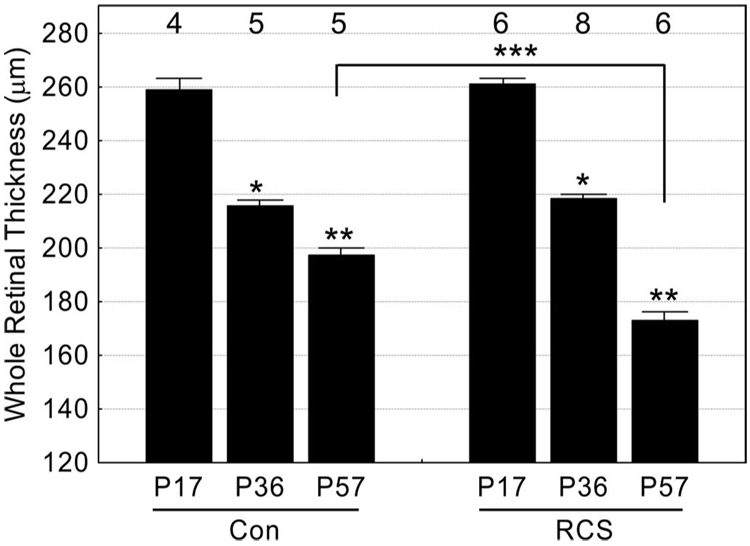
FIGURE 1.
Total retinal thickness measurements for male RCS rats at three time points: before (at developmental stage P17) and during (P36 and P57) photoreceptor degeneration. Age-matched control (con) rats were also studied. Numbers of animals used to generate these data are listed above bars. Error bars represent SEM. Brackets represent between-group comparisons with P < 0.05. *Significant differences from P17 data. **Significant differences from P17 and P36 data. ***Significant differences between P57 groups.

