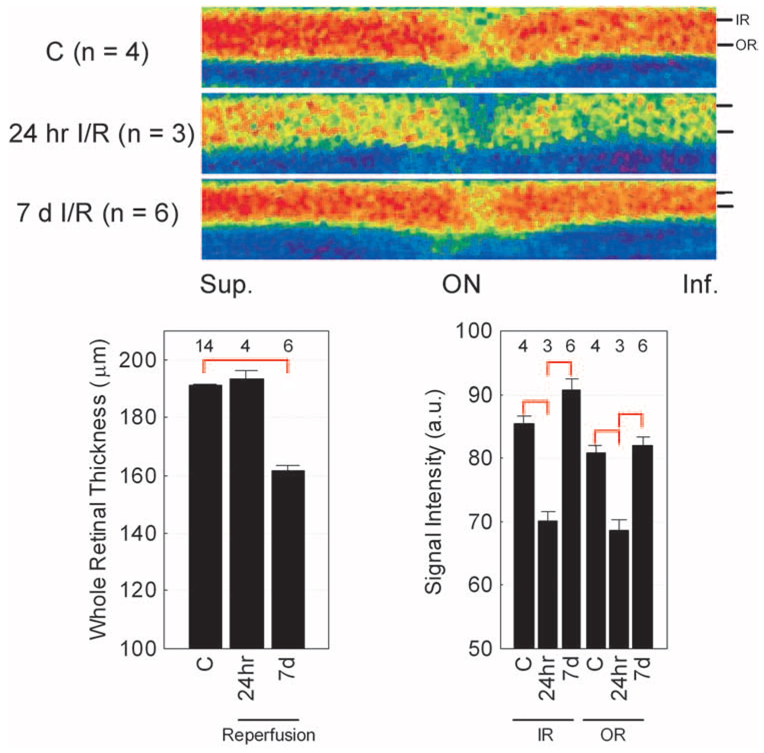
FIGURE 3.
Summary of changes in MEMRI intraretinal signal intensity in I/R. Top: pseudocolor linearized images of average retinal signal intensity in central retina of dark-adapted control female Sprague–Dawley rats (top, C; n = 4) after 24 hours of reperfusion (middle, 24-hour I/R; n = 3) and 7 days of reperfusion (bottom, 7 d I/R; n = 6). The same pseudocolor scale was used for both linearized images, where blue to green to yellow to red represent lowest to highest signal intensity. The intraretinal location used to extract inner (IR) and outer (OR) retinal data used in this study is indicated on the right of each linearized image. The scale on the bottom indicates the location of the optic nerve (ON) and superior and inferior directions. Bottom: summary of temporal evolution of whole retinal thickness (left) and inner (IR) and outer (OR) retinal signal intensities. Red brackets: between-group comparisons, with P < 0.05. Error bars represent SEM, and numbers over bars are numbers of animals studied.

