
Figure 2.
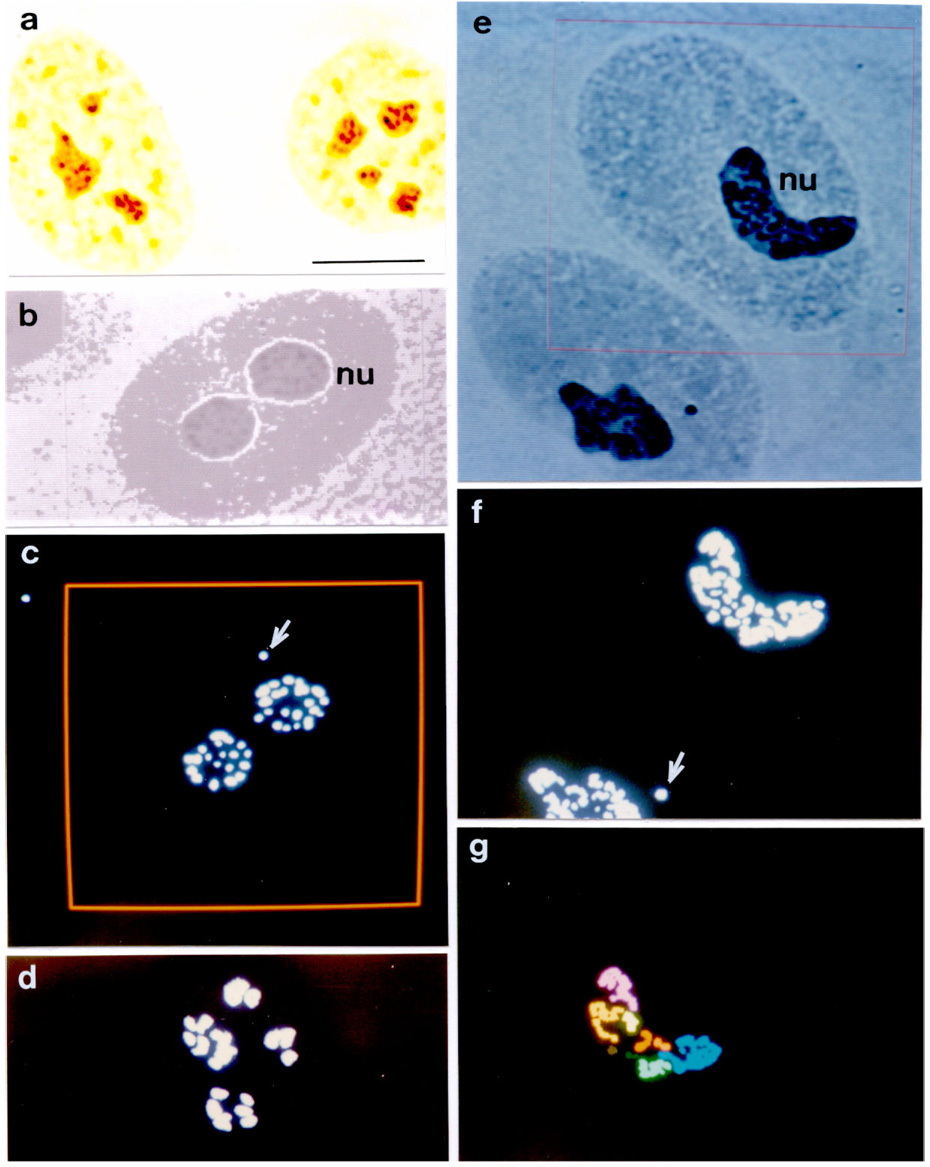
AgNOR staining in nucleoli (nu) of nontransformed and transformed MCF-10A cells. a. AgNOR response (black dots) in control MCF-10A cells: photomicrograph obtained directly from the microscope. Bar, 10 µm. b–g. Examples of some steps of the segmentation procedure and feature evaluation of the image analysis by Kontron-IPS system of AgNOR-stained particles or aggregates as photographed from the color monitor. b. Original image (TV on) of one MCF-10A cell nucleus. c. Grey level segmentation of the AgNOR-stained dots of the nucleus shown in b. The arrow indicates a positive dot in a putative Cajal body. The area under analysis is delimited by the red frame. d. Grey level segmentation of the AgNOR-stained dots of an MCF-10Aneo cell nucleus. e. Original image (TV on) of two MCF-10AneoT cell nuclei. The nucleus to be analyzed is inside the area delimited by the red frame. f. Grey level segmentation of the AgNOR-stained particles of the image shown in e. The arrow indicates a positive dot in a putative Cajal body. g. Identification of the AgNOR-stained image of the nucleus shown inside the frame area in e. Different pseudocolors identify aggregates of dots not in contact with each other.