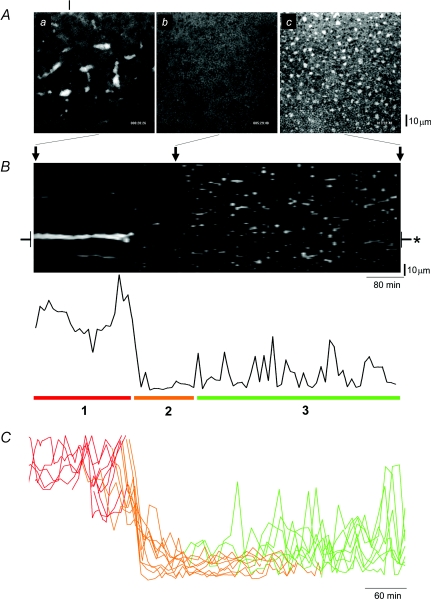
Figure 1. ER subdomain morphology during Xenopus oocyte maturation.
A, lateral (‘xy’) confocal images of DsRed2-ER fluorescence in the vegetal hemisphere of the same Xenopus oocyte, taken ∼20 min (a), 5.5 h (b) and 14 h (c) from a timelapse movie (Supplemental Movie 2) started on addition of progesterone (1 μg ml−1). The vertical line indicates the linescan position used for the projection in B. B, upper panel, projection (‘xt’) of a timelapse stack into a single ‘lamellogram’ image, showing fluorescence across a single spatial dimension (vertical axis) over time (horizontal axis). Positions in this projection corresponding to the images shown in A are indicated by arrows; lower panel, fluorescence intensity profile measured from region (asterisked) on lamellogram. C, overlay of fluorescence profiles from multiple lamellograms (n = 10) revealing three phases of ER remodelling (1, red; 2, orange; 3, green) are conserved in different cells. Given the variable timeframe of maturation in single cells, profiles are aligned to the end of phase ‘1’ in each timelapse record.

