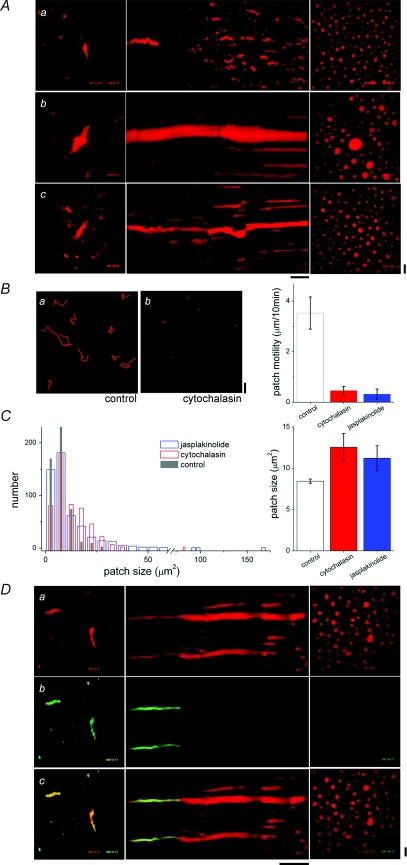
Figure 3. Effect of cytoskeletal disruption on ER remodelling during maturation.
A, lamellograms of maturing oocytes subjected to treatment with cytoskeletal-disrupting agents. Sequences show cells treated with 70 μm nocodazole (a), 2.5 μm jasplakinolide (b, Supplemental Movie 6), and 50 μm cytochalasin B (c). Horizontal time bar represents 1 h (a and b) and 30 min (c). B, patch motility measured from timelapse records of mature control cells and mature cells treated with cytochalasin or jasplakinolide. Left, tracking patch motility in control (a) and cytochalasin-treated cells (b) at 10 min intervals from hour-long timelapse records. Right, average patch motility for indicated treatments. C, left, histogram showing distribution of patch sizes (cross-sectional area, μm2) in mature control cells (grey), or cells treated with cytochalasin (red) or jasplakinolide (blue). Right, average patch size for different treatments. D, composite lamellogram of a cell expressing DsRed2-ER (a) and injected with Alexa Fluor 488-WGA (b) matured in the presence of cytochalasin (middle) with the overlay (c) shown at bottom. Horizontal time bar represents 1 h. All vertical scale bars = 10 μm.

