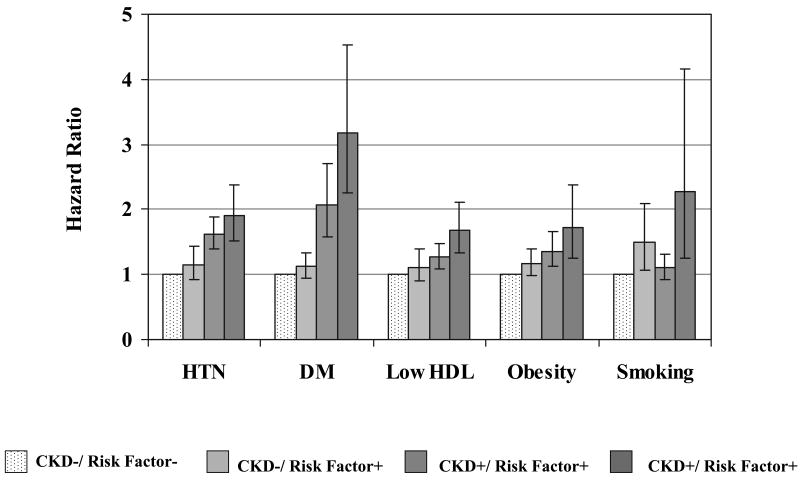
Figure 2.
Chronic kidney disease and incident cardiovascular disease: risk factor subgroups. Bars represent 95% confidence intervals. Age- and sex-adjusted p-values for the interaction of CKD with the following risk factors: hypertension p=0.93; diabetes p=0.17; low HDL cholesterol p=0.004; obesity p=0.72 smoking p=0.35.
Sample sizes for figure.
| CKD-/Risk factor- | CKD-/Risk factor+ | CKD+/Risk factor- | CKD+/Risk factor+ | |
|---|---|---|---|---|
| Hypertension | 1042 | 559 | 46 | 44 |
| Diabetes Mellitus | 1501 | 105 | 76 | 14 |
| Low HDL cholesterol | 995 | 611 | 44 | 46 |
| Obesity | 1345 | 261 | 74 | 16 |
| Smoking | 1125 | 74 | 481 | 16 |
CKD=chronic kidney disease; HDL=high density lipoprotein

