
Figure 3.
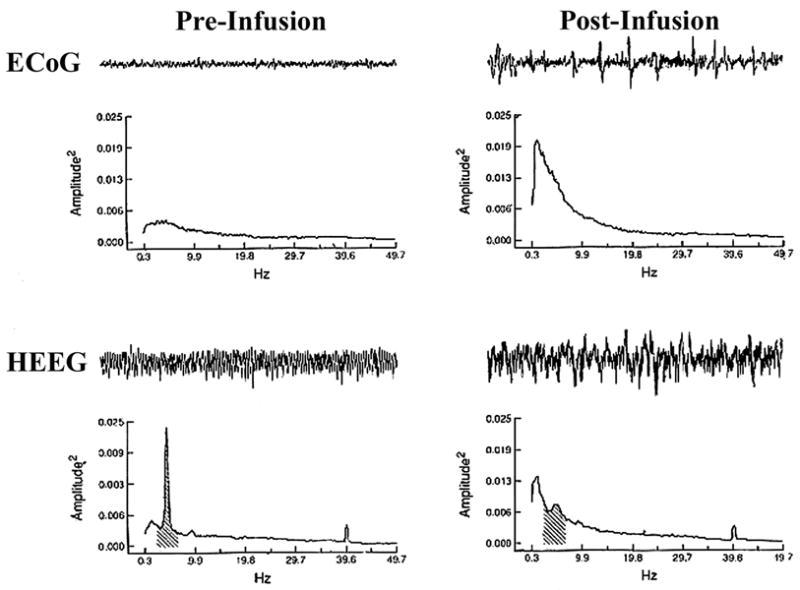
Effects of bilateral suppression of LC discharge in the lightly-anesthetized rat. Shown are the effects of bilateral clonidine infusions (100 ng in 100 nl) that resulted in the complete bilateral suppression of LC discharge activity. Shown are 25-sec raw EEG traces for cortical EEG (ECoG; top row) and hippocampal EEG (HEEG; bottom row) along with the results of power spectral analysis (PSA; graphs below the raw traces) calculated on an 8-min epoch from which the 25-sec EEG trace was taken. Data from pre-infusion (left column) and post-infusion (right column) periods are displayed. The most striking post-infusion changes in the ECoG are the increase in the slowest frequencies, and in the HEEG, the dramatic reduction in theta activity and the appearance of mixed-frequency activity. Shading in the PSA plots indicates the theta frequency band (2.3–6.9 Hz) in the HEEG power spectra (see [23]).