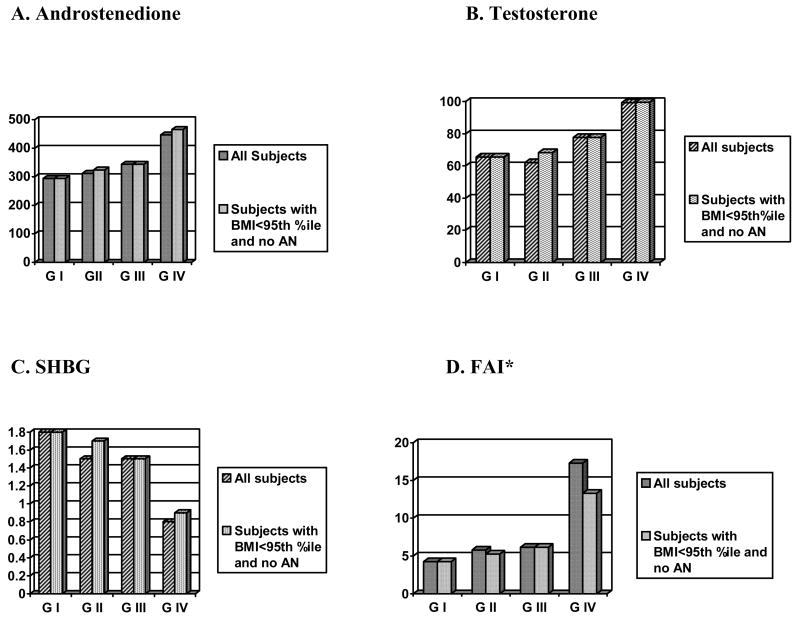
Figure 1. Androgen Comparisons Among Groups Excluding Subjects with Both Overweight (BMI>95th %ile) and Acanthosis Nigricans (AN).
* For FAI: ANOVA (p<0.05)/Post-hoc Scheffe, Group I vs IV, (p<0.05), II vs IV, (p=0.09)
All subjects: For SHBG, Δ4A - Ns are 41, 41, 15, and 21 for GI, GII, GIII, and GIV, respectively; for T and FAI - N is 36, 36, 14, and 19 for GI, GII, GIII, and GIV, respectively. Subjects with BMI<95th % ile and no AN: For SHBG, Δ4A - Ns are 41, 14, 15, and 4 for GI, GII, GIII, and GIV, respectively; for T and FAI, N is 36, 12, 14, and 3 for GI, GII, GIII, and GIV, respectively.

