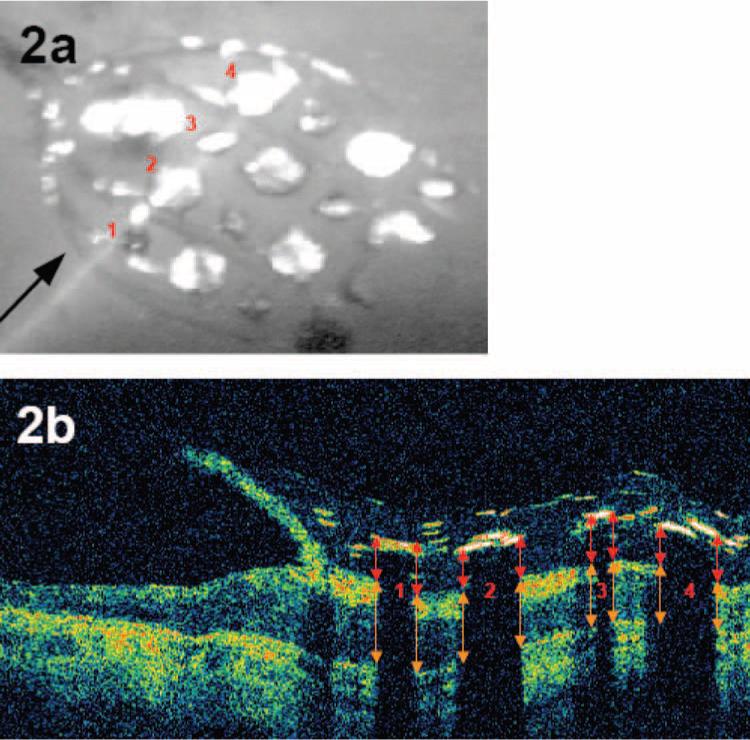
Figure 2.

OCT imaging of the array. (a) Fundus photograph of an intraocular electrode array viewed through a dilated pupil, imaged by the OCT system, just previous to the cross-sectional OCT image shown in (b). (b) Cross-sectional OCT image, in which the color represents log reflection. Red and orange arrows indicate how electrode distance and retinal thickness were measured.
