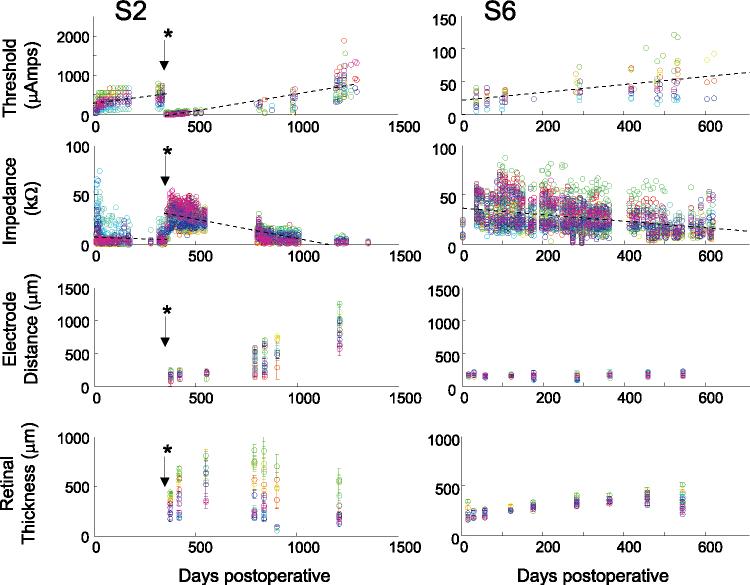
Figure 5.
Thresholds, impedance, distance between the electrodes and the retinal surface, and retinal thickness as a function of time in two subjects. Each color represents a different electrode. The x-axis represents days after surgery. In each subject, we calculated the best-fitting linear regression over time across all electrodes. First row: thresholds as a function of time. The y-axis represents threshold current for a 0.975-ms pulse. Note that both x- and y-axes differ across subjects. *S2's array detached from the retina after 11 months when the subject fell and bumped her head, and the array was then reattached. For this subject, we calculated separate linear regressions for each array attachment. Thresholds were lower and impedances higher after reattachment. For both subjects the mean best-fitting linear regression line (across all electrodes) is shown (black dotted line). Second row: impedance as a function of time. The mean best-fitting linear regression line (across all electrodes) is shown (black dotted line). Third row: distance between the electrodes and the retinal surface, as measured with OCT. Fourth row: retinal thickness as measured with OCT. Error bars, ± 1 SEM.

