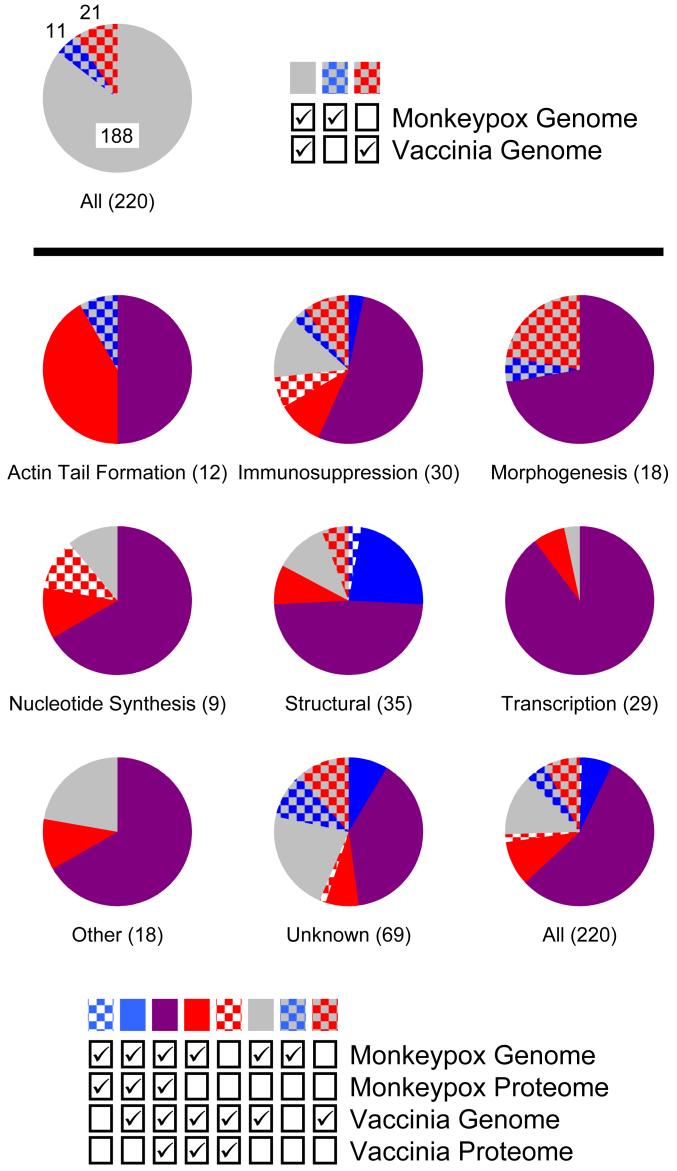
Figure 3. Comparison of the Viral Proteomes in Context of the Two Genomes.
Each viral protein was assigned one of eight functional annotations (Actin Tail Formation, Immunosuppression, Morphogenesis, Nucleotide Synthesis, Other, Structural, Transcription, or Unknown). Additionally, each protein was classified as being present or absent from each viral genome and proteome (note that to be present in the proteome it had to be present in the corresponding genome). A majority of the proteins (188/220) were encoded by both genomes (i.e., were homologs between MPV and VV), but 32 were encoded by only one of the two genomes (top pie chart) (the MPV and VV genomes encode 199 and 209 predicted proteins, respectively). For each of the eight functional annotations (Actin Tail Formation, Immunosuppression, etc.) and for all of the proteins combined, the percentage of each protein classification (i.e., absent or present in each genome and proteome) is displayed as a pie chart (bottom nine pie charts). The total number of proteins assigned to each functional annotation is indicated in parenthesis.

