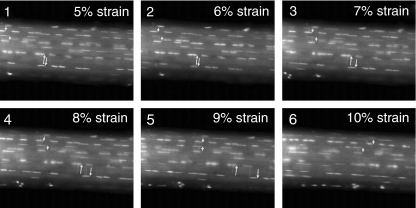
Figure 4.
Time-lapse confocal images of a rat tail tendon being strained at a rate of 20 μm/s. The cell nuclei have been stained with acridine orange and the pairs of short and long arrows identify cell nuclei used as fiduciary markers to demonstrate fibril sliding. At 7% strain (image 3) the lower (long) pair of arrows can be seen separating indicating fibre slippage. This separation continues to increase with increasing strain (images 4 and 5). After 8% strain (image 4) the upper (short) pair of arrows begin to get closer and pass over one another at 9% strain (image 5). This slippage continues to increase at 10% strain (image 6). In both instances, fibril slippage occurred in advance of complete tendon rupture (Arnoczky et al. 2007).

