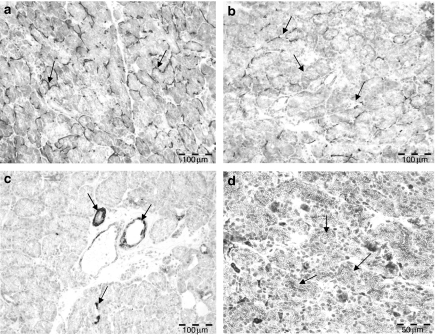
Figure 2.
(a) Immunohistochemical expression pattern of α-SMA in the control lachrymal glands showing a basket-like pattern in the acinar region (arrows). (b) The inferior lachrymal gland 72 h after irradiation with 15 Gy shows a marked loss of α-SMA reaction in the acinar region, the labelling displayed an irregular pattern and is limited to scattered acini. (c) Tenascin-C expression is observed in the duct system and blood vessels of control lachrymal glands (arrows); the acinar cells themselves are not labelled. (d) Seventy-two hours following irradiation, the acinar cells display an excessive intracellular expression of tenascin-C (arrows). Bar = 100 µm.

