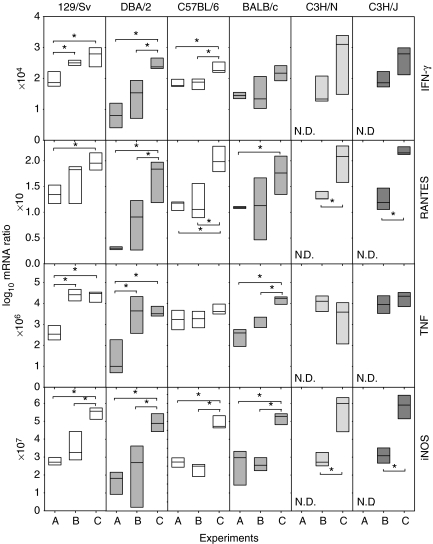
Figure 7.
Evolution of mRNA expression of Th1 response related cytokines, TNF and iNOS in the lungs at week 9 post-infection. These are expressed as the log10 of the ratio obtained after dividing every value by the expression of HPRT in each sample and multiplying it by a factor (ranging from 10 to 107). Data are graphed as a box representing statistical values. The boundary of the box closest to zero indicates the 25th percentile, a line within the box marks the median, and the boundary of the box farthest from zero indicates the 75th percentile. Differences between mice groups were significant when marked with * (P < 0.05).

