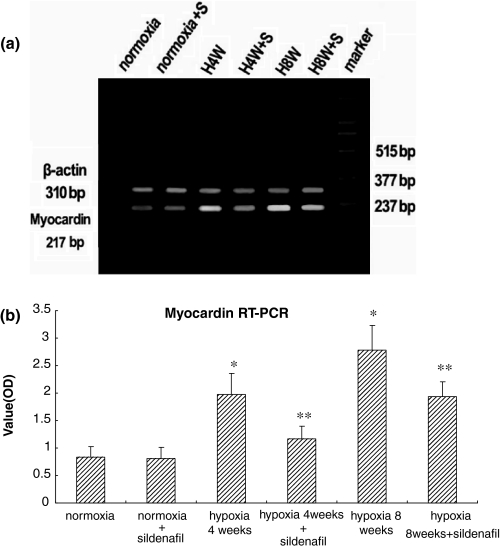
Figure 5.
Reverse transcription polymerase chain reaction (RT-PCR) analysis of myocardin among the six groups of rats. (a) RT-PCR analysis of myocardin and β-actin gene expression in representative rat lungs from six groups. (b) Quantitation of myocardin mRNA levels, results are means ± SD; n = 10 rats in each group. *P < 0.01 for normoxia vs. all the other groups but normoxia + sildenafil. **P < 0.01 for within hypoxia 4 weeks group (hypoxia vs. hypoxia + sildenafil) and for within hypoxia 8 weeks group (hypoxia vs. hypoxia + sildenafil) respectively.

