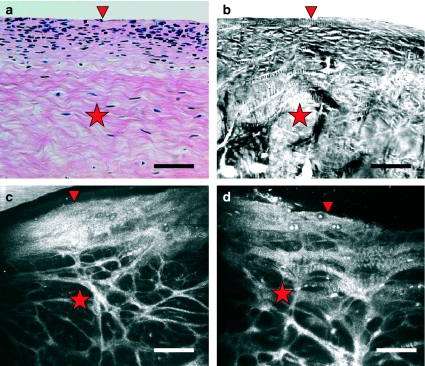
Figure 1.
Comparison of vertical sections of human knee meniscus as seen with routine haematoxylin – eosin staining examined under light microscopy (a), cross-polarized light microscopy (b) and near-infrared reflectance confocal microscopy imaging of intact tissue exposed to phosphate-buffered saline (b) and to acetic acid (d). The densely cellular top layer (arrowhead) and the more fibrillar interior (star) are readily depicted in the four images. Scale bar represents 100 µm.

