Figure 8.
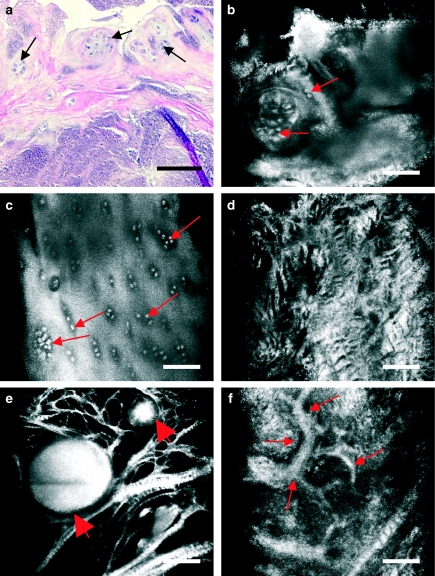
Human knee meniscus affected by chondrocalcinosis imaged with routine light microscopy (a) and near-infrared, reflectance confocal microscopy (CM) (b–f). Calcium pyrophosphate dihydrate deposits appear in a patchy form. CM reveals how the hypertrophic cells show a greater tendency to form clusters (a–c, arrows). The matrix also changes its morphology and refractility, appearing disorganized and devoid of the regular zebra pattern (d). Crystal deposits are visualized as large, hyperefractile globular masses (e, arrows) amidst thinned matrix fibres. The size of these deposits varies, with values ranging from 50 to 217 µm. Aberrant vascular structures are visualized within the tissue (f, arrows). Scale bar represents 100 µm.

