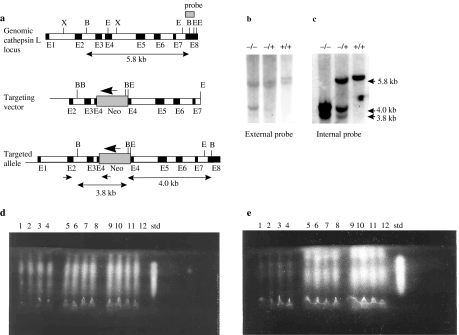
Figure 1.
Targeted disruption of the cathepsin L gene locus. (a) Homologous recombination at the cathepsin L gene locus. The structural organization of the cathepsin L gene is represented by the top line. Exons are shown by filled boxes designated E1–E8. The middle line shows the targeting vector containing a neo expression cassette inserted into exon 4. The neo is transcribed in the opposite orientation to the cathepsin L gene, shown by the large arrow. The lower line shows the predicted structure of the locus following targeted integration. Positions of polymerase chain reaction (PCR) primers used in the primary screen are indicated by small arrows. The 5′ primer is in the region flanking the targeting vector. The external Southern probe hybridizing to part of exon 8 is shown as a dark box. Restriction sites: B (BglI); E (EcoRI); X (XhoI). Exon sizes are not to scale. (b) Genomic Southern blot of DNA from homozygote knockout (−/−), heterozygote knockout (+/−) and wild-type (+/+) mice, digested with BglI and probed with the external exon 8 probe are shown. (c) Genomic Southern blot from panel b, stripped and re-probed with an internal cDNA probe spanning exons 2–6. Fragment sizes for both panels b and c are shown to the right. (d) Analysis of cathepsin L and B levels in liver homogenates from four homozygote knockout mice (lanes 1–4), four heterozygote knockout (lanes 5–8), four wild-type (lanes 9–12) mice and purified human cathepsin L (std) using isoelectric focusing gel overlaid with the synthetic substrate, Z-Phe-Arg-NMec. (e) Analysis of cathepsin L, as panel d, except for the addition of the cathepsin B-specific inhibitor Ca074.

