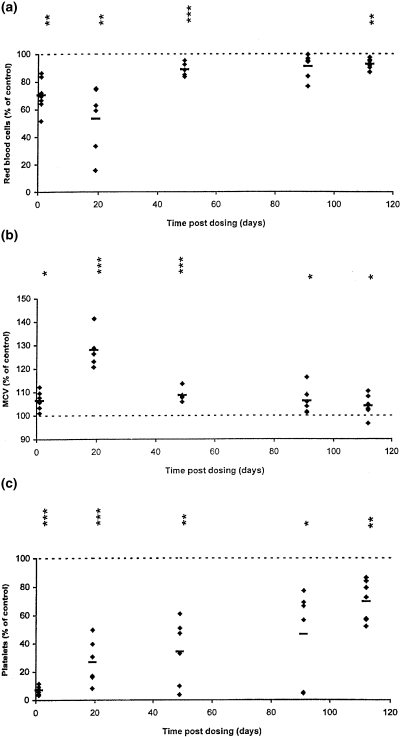
Figure 1.
Hematological parameters from individual mice, expressed as a percentage of the mean control value at each time point, at 1, 19, 49, 91 and 112 days after BU dosing at 10.50 mg/kg (a), red blood cells; (b), mean cell volume; (c), platelets; (d), lymphocytes. Horizontal bars indicate group means; *P < 0.05, **P < 0.01, ***P < 0.001 are presented vertically above the data points (see Table 1).


