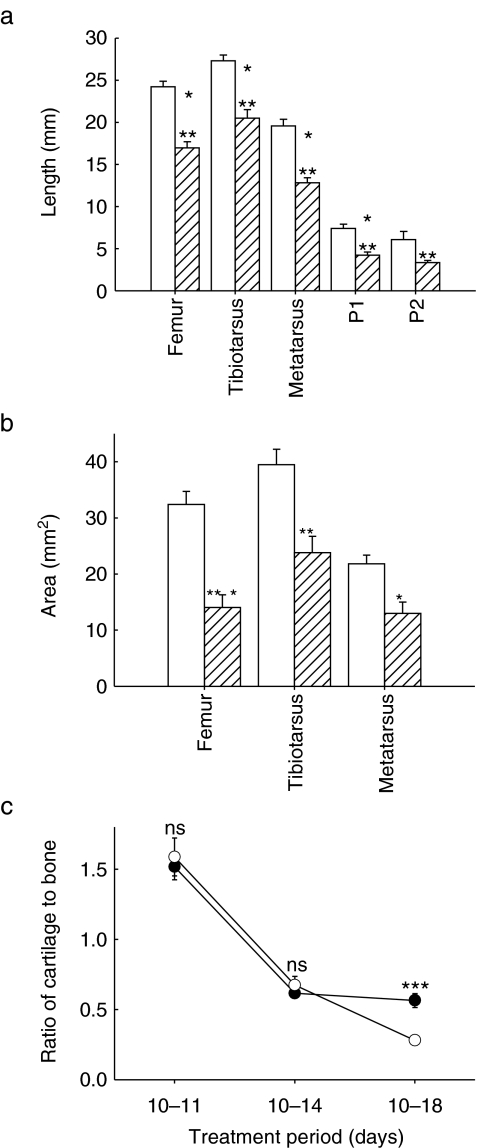
Figure 4.
Altered skeletal development induced by flaccid immobilization. (a) Effect of flaccid immobilization between stages 36 and 44 on length of femur, tibiotarsus, metatarsus, first (P1) and second (P2) phalanges ( ) and control embryonic chicks (□). (b) Effect of flaccid immobilization on relative area of Alizarin red-stained bone in femur, tibiotarsus and metatarsus. Data are expressed as mean ± standard error of mean for at least nine chicks. □, control chicks;
  , flaccidly immobilized chicks. (c) Effect of flaccid immobilization on the ratio of cartilage to bone in tibiotarsus, metatarsus and femur. Data are expressed as the mean ± standard error of mean for all limbs pooled. □, control chicks;
  , flaccidly immobilized chicks. Statistical analysis was performed using the Student's t-test where * denotes P < 0.05, ** denotes P < 0.01 and *** denotes P < 0.001.

