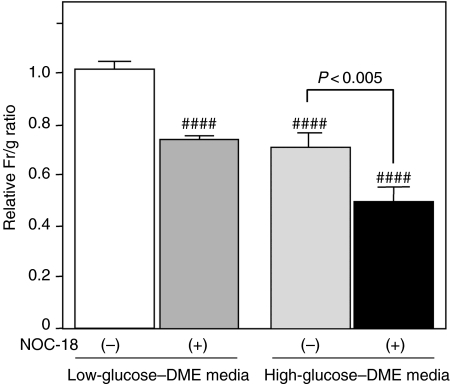
Figure 5.
Changes in mitochondrial transmembrane potential after treatment with NOC-18. Changes in the membrane potential (ΔΨ) are quantified as relative ratios of Fr/g-values. White column, the cells incubated with low glucose without NOC-18 treatment; grey column, the cells treated with NOC-18 under low-glucose condition; dotted column, the cells incubated with the high-glucose medium without NOC-18 treatment; black column, the cells treated with NOC-18 under high-glucose condition. The ratios significantly decreased in the cells treated with NOC-18 under low-glucose condition and the cells incubated with the high-glucose medium, regardless treatment with NOC-18 (####, P < 0.0001), although treatment with NOC-18 promoted mitochondrial depolarization in the cells under high-glucose condition (P < 0.005).

