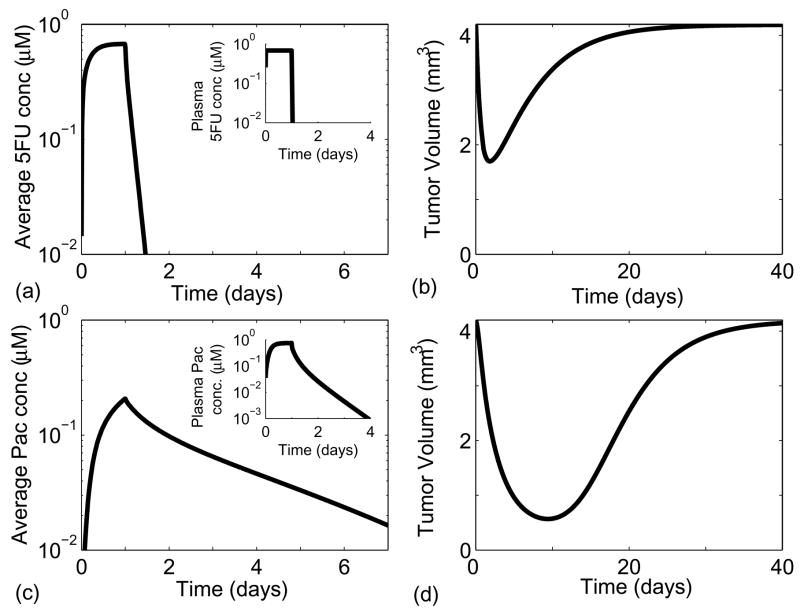
Figure 6.
Effects of 5-fluorouracil (a and b) and paclitaxel (c and d) on simulations of tumor growth. Pharmacokineticsg were incorporated by varying drug concentration at the tumor periphery according to the solution of the multi-compartmental models. Both drugs were administered intravenously for 24 hours. Figures (a) and (c) show the average tissue concentration of paclitaxel and 5-fluorouracil, respectively. The insets in figures (a) and (c) show the drug concentration in plasma as a function of time. Due to slow diffusion and clearance paclitaxel is retained in the tumor for longer than 5-fluorouracil. Figure (b) and (d) show the extent of spheroid shrinkage following the administration of 5-fluorouracil and paclitaxel, respectively.

