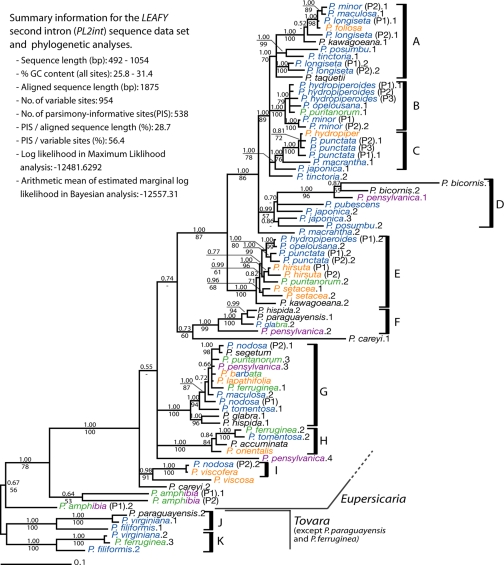
Fig. 1.
Fifty percent majority-rule consensus tree from Bayesian inference. Posterior probabilities from Bayesian analyses are above the branch, and bootstrap values from maximum likelihood are below. Colors of taxon names represent ploidy: orange = diploid, blue = tetraploid, green = hexaploid, purple = octaploid, black = chromosome number unknown. See Table S1 for voucher information. P#, population number; .1, .2, .3, .4, clone number.

