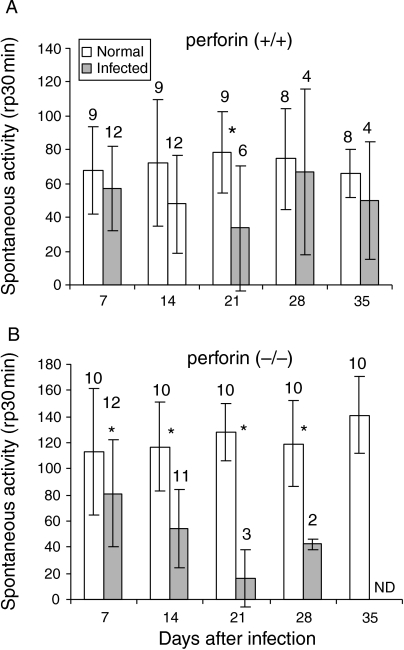
Figure 2.
Spontaneous physical activity of normal and infected perforin (+/+) (a) and (−/−) mice (b), infected with 104 trypomastigote forms of Y strain T. cruzi. Data represent mean ± standard deviation. The number of mice analysed on each day post-infection (indicated upon the bars) decreased due to mortality in the course of infection. (*) Indicates statistically significant differences (P < 0.05) of infected mice as compared to non-infected mice.

