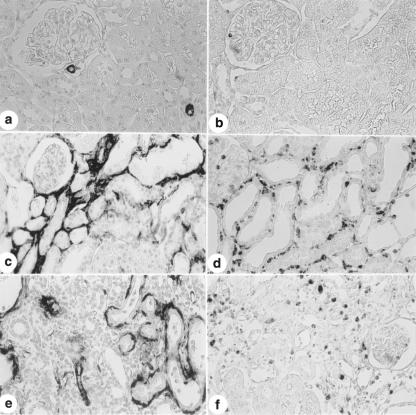
Figure 3.
Immunolocalization of α-SM-actin (a, c and e) and ED1 (b, d and f) in the renal cortex from a control rat (a and b) and from rats killed 5 (c and d) and 30 days (e and f) after glycerol injection. Note that the staining for α-SM-actin is more intense in c and e than in a and the increase of ED1 + cells (monocytes/macrophages) is more marked in d and f compared to b. X280.

