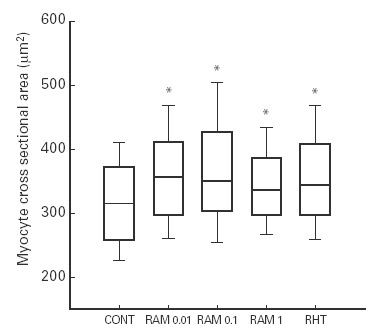
Figure 2.

Myocyte cross-sectional area in controls (CONT) and in renovascular hypertensive rats with no treatment (RHT) or treated with nonantihypertensive doses of ramipril (RAM0.01, RAM0.1 and RAM1). The lower boundary of the boxes indicates the 25th percentile, the line within the boxes marks the median, and the upper boundary of the boxes indicates the 75th percentile. Error bars above and below the boxes indicate the 90th and 10th percentiles. *P < 0.05 vs. Control.
