
Figure 5.
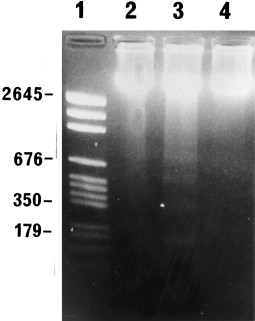
Agarose gel electrophoresis of DNA extracted from saline controls (2 days) (lane 2) and animals 2 days (lane 3) and 7 days (lane 4) after commencement of caerulein injections. Note typical ladder pattern of apoptosis in lane 3. DNA molecular weight markers, lane 1.