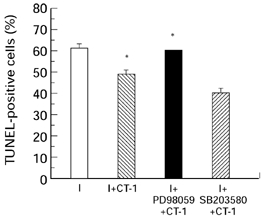
Figure 2.

Percentage of TUNEL positive cells in the cardiac myocytes treated with CT-1 and the various signal transduction inhibitors 30 min prior to exposure to simulated lethal hypoxia/ischaemia (I). I + CT-1 ( ); I + CT-1 in the presence of 50μm PD98059 (▪) or 10μm SB203580 (
 ). Untreated cardiac myocytes (□). The cells were fixed using 4% paraformaldehyde and the percentage of TUNEL positive nuclei were analysed using fluorescein-12 dUTP and terminal transferase. Values are the means of three determinations whose S.E.M. is shown by the bars. *P < 0.05.
