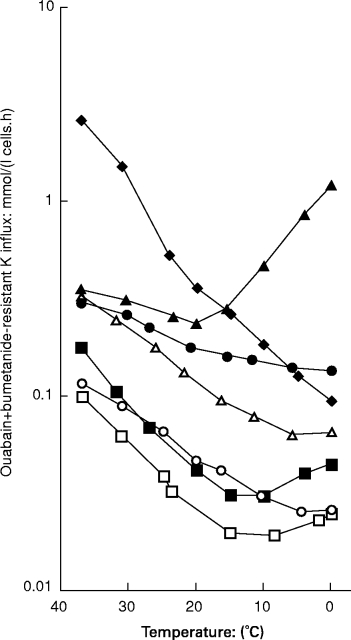
Figure 2.

Comparison of ‘leak’ tracer fluxes across the red cell membrane as a function of temperature in different kindreds. The degree of haemolysis is roughly proportional to the ‘leak’ at 37°C. The normal temperature profile (□) shows a minimum at about 10°C. Families A (○) and B (•) show a ‘shallow slope’ variant such that the the slope in the interval 37–20°C is less steep than normal. While Family A shows negligible haemolysis, family B has frank haemolytic anaemia, proportionate to the abnormality in leak at 37°C. Family C (cryohydrocytosis, ▴) shows a ‘high minimum’ effect such that the minimum which occurs in normal cells at 10°C is shifted up to 23°C. Families D (dehydrated HSt, ▪) and F (Woking, ▵) shows a profile that is simply parallel to normal. Family E (overhydrated HSt, ♦) shows a monotonic profile with no minumum.Red cells were washed in 150 mm NaCl, 15 mm MOPS (pH 7.4 at 23°C), 5 mm glucose and suspended to about 5% haematocrit in this solution with 0.1 mm ouabain and bumetanide. K(86Rb) was added to a final concentration of 5 mm and the cells were incubated at the temperatures shown for 30–120 min, before being washed free of extracellular isotope prior to lysis, deproteinization and scintillation counting for trapped radioactivity (Coles et al. 1999b). Data is redrawn from the following sources: Family A (Stewart & Ellory 1985); B (Coles et al. 1999b); C (Coles et al. 1999a); D & E (Stewart 1993); F, unpublished.
