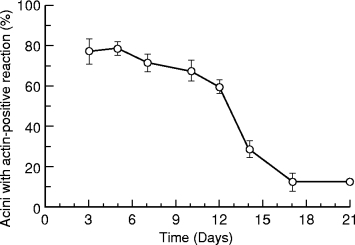
Figure 2.

Changes in percentage of acini with actin-positive reactions at the periphery in experimental parotid glands after removal of clips. The highest is 78.4% on day 5 and the lowest is 12.5% on day 17 and 21. The mean in controls is 9.3% (not shown in the graph). (n = 4 for experimental animals at each time point; results expressed as mean ± SD)
