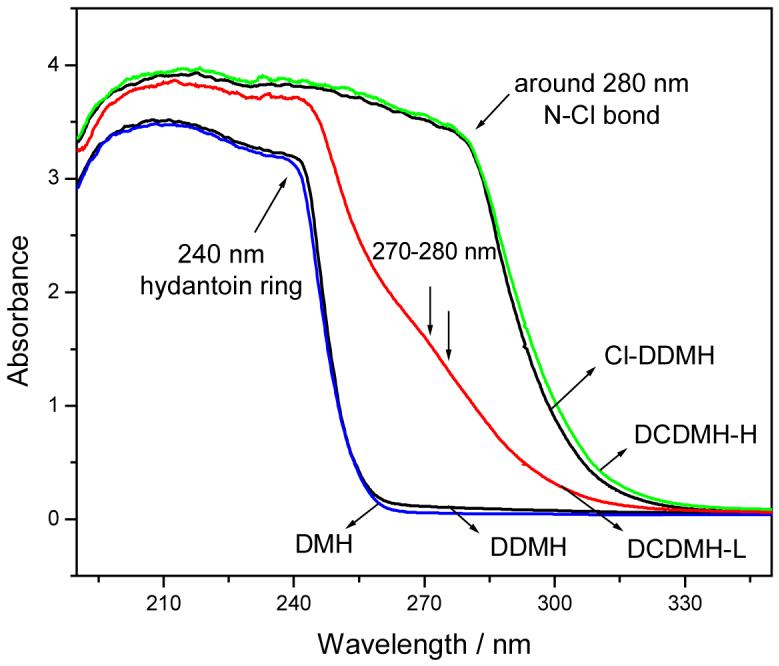
Figure 3.

UV spectra of DMH, DDMH, Cl-DDMH, and 1,3-dichloro-5,5-dimethylhydantoin (DCDMH). Solvent: methanol. In the spectra of DMH, DDMH, DCDMH-H or Cl-DDMH, the sample concentration was 0.05 mol/L; in the spectrum of DCDMH-L the sample concentration was 0.01 mol/L.
