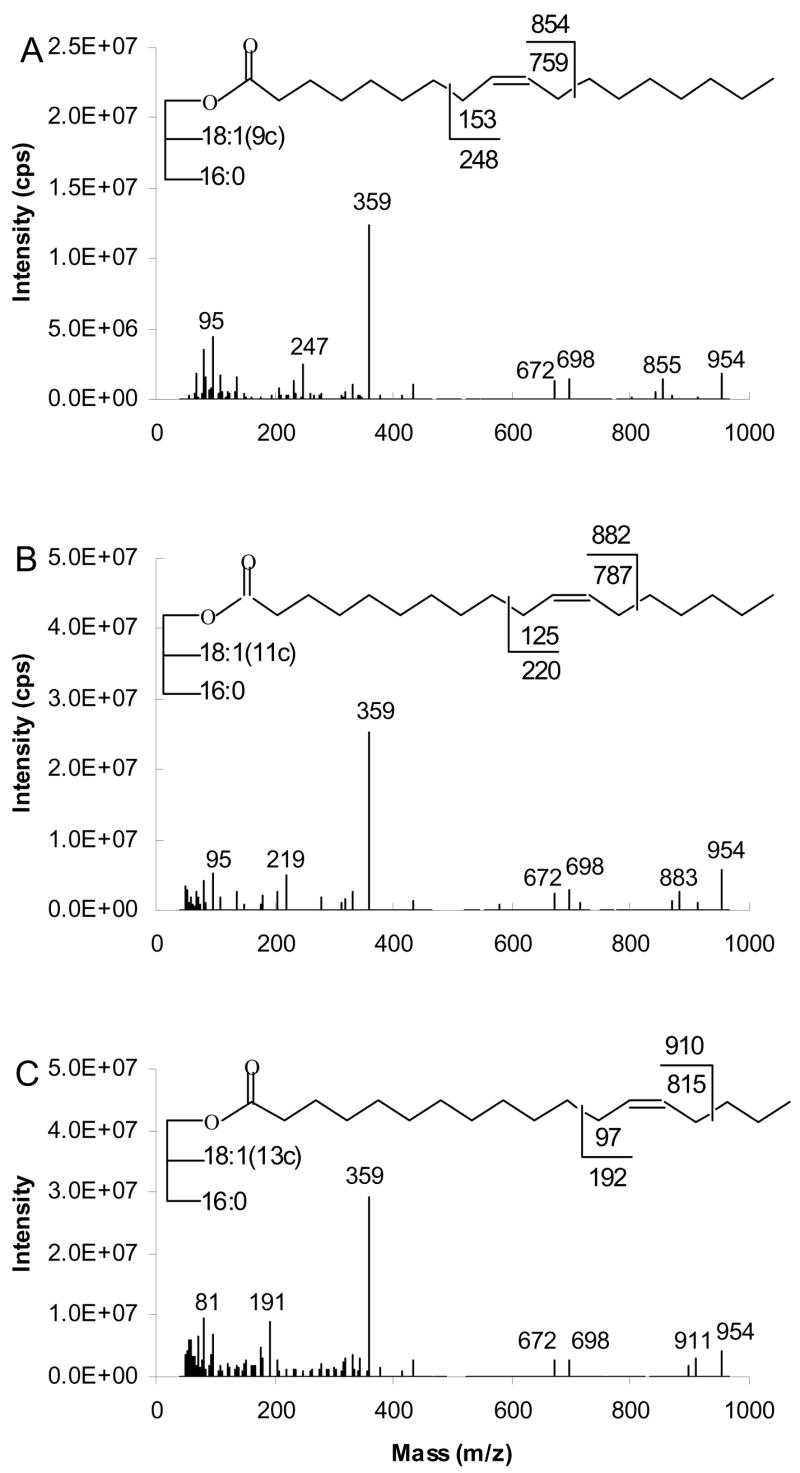
Figure 13.

[M+95]+- based APCACI-MS/MS spectra for m/z 954 of (A) (16:0/9-18:1/9-18:1)-TAG (B) (16:0/11-18:1/11-18:1)-TAG (C) (16:0/13-18:1/13-18:1)-TAG. Specific cleavages at the allylic carbons shown in the structures at the top of each spectrum give rise to a pair of diagnostic ions.
