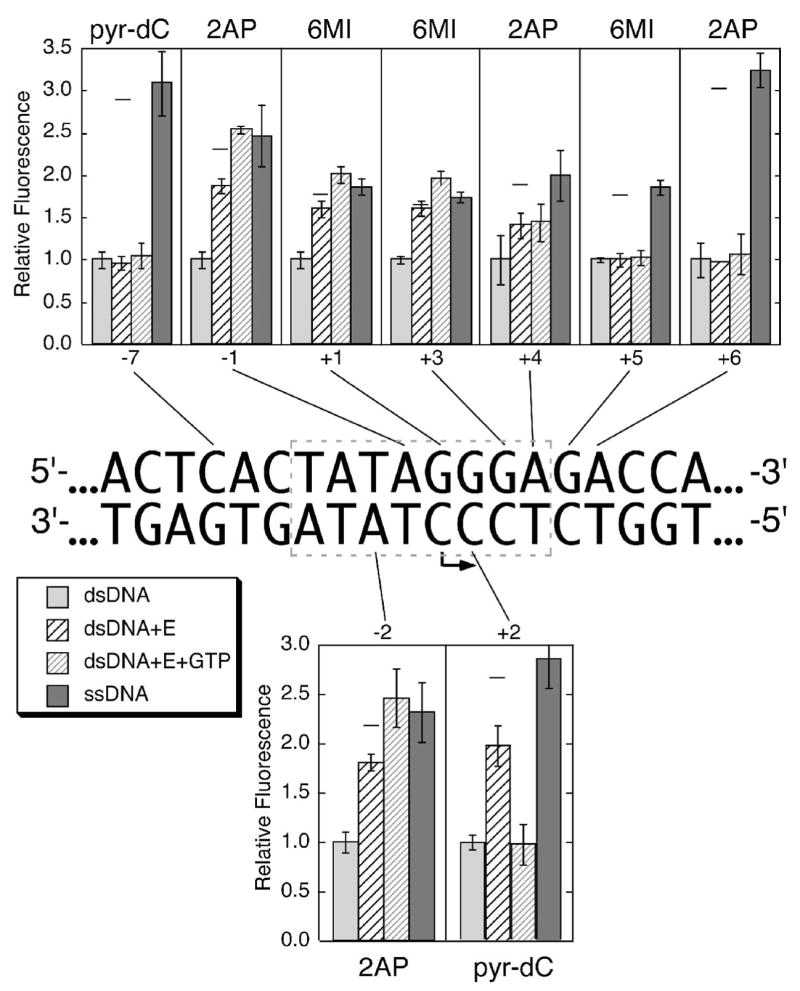
Figure 3. Fluorescence measurements from nine different constructs incorporating pyr–dC, 2–AP, or 6–MI at individual positions both upstream and downstream of the start site for the initiation of transcription.

Fluorescence measurements for each construct were taken (in order, from left to right within a set) as follows: 1) double stranded DNA in transcription buffer, followed by 2) addition of enzyme to an equimolar concentration, then 3) addition of GTP to 1.0 mM (allows initiation and cycling to position +3). Concentrations of polymerase and promoter were each 1.0 μM, except for constructs with labels at positions +4 and +6, which were at concentrations of 2.0 μM. Lane 4 measures fluorescence of the single (nontemplate) strand containing the indicated fluorophore. Relative fluorescence values for each group are normalized to the fluorescence in double stranded DNA for that construct. Each value represents the average of three separate measurements (with standard deviation as indicated).
