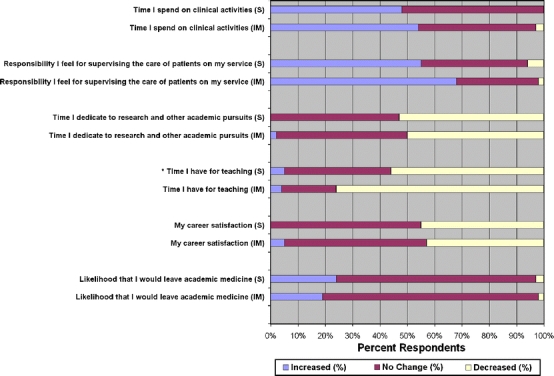
Figure 1.

Reported effects of work hour limitations on professional life. The figure shows the proportion of respondents for Surgery (S) and Internal Medicine (IM) reporting effects of work hour limitations on aspects of professional life. The blue bars represent the proportion reporting an increase because of the work hour limitations, the red bars represent the proportion reporting no change, and the yellow bars represent the proportion reporting a decrease. * p ≤ 0.05 for surgery vs medicine.
