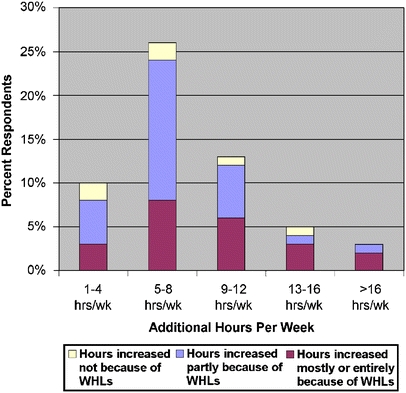
Figure 2.

Additional clinical work hours reported by attending physicians. The figure shows the distribution of additional clinical hours reported by attending physicians. Red bars indicate the percent of total respondents reporting an increase “mostly or entirely because of WHLs, blue bars indicate those reporting an increase “partly” because of WHLs. The yellow bars indicate those reporting an increase not attributed to WHLs.
