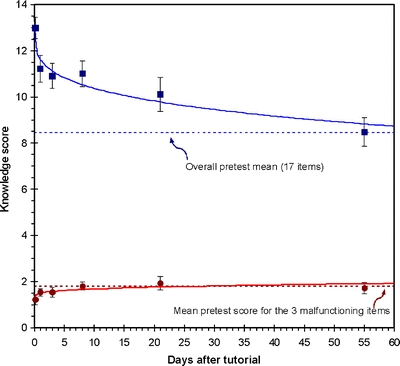
Figure 2.

Chart of knowledge test results for each time interval after the tutorial with squares representing the mean scores on the final 17-item posttest and circles representing the sum of scores on the posttest for the 3 malfunctioning items. Horizontal dotted lines represent subjects’ mean knowledge scores before the tutorial for each of the 2 item groups. Vertical bars show the standard error of the mean. Solid lines represent the best linear fit for each outcome versus the time delay, after fourth-root transformation of the time interval. (17-item posttest score = 13.3–1.63t1/4, R2 = 0.27, P < .0001; posttest sum of 3 malfunctioning items = 1.26 + 0.23t1/4, R2 = 0.05, P = .04.).
